🍂 Intro
Fall is in full swing across New England. The leaves are near their peak color and the housing market is cooling everywhere except a few shoreline towns.
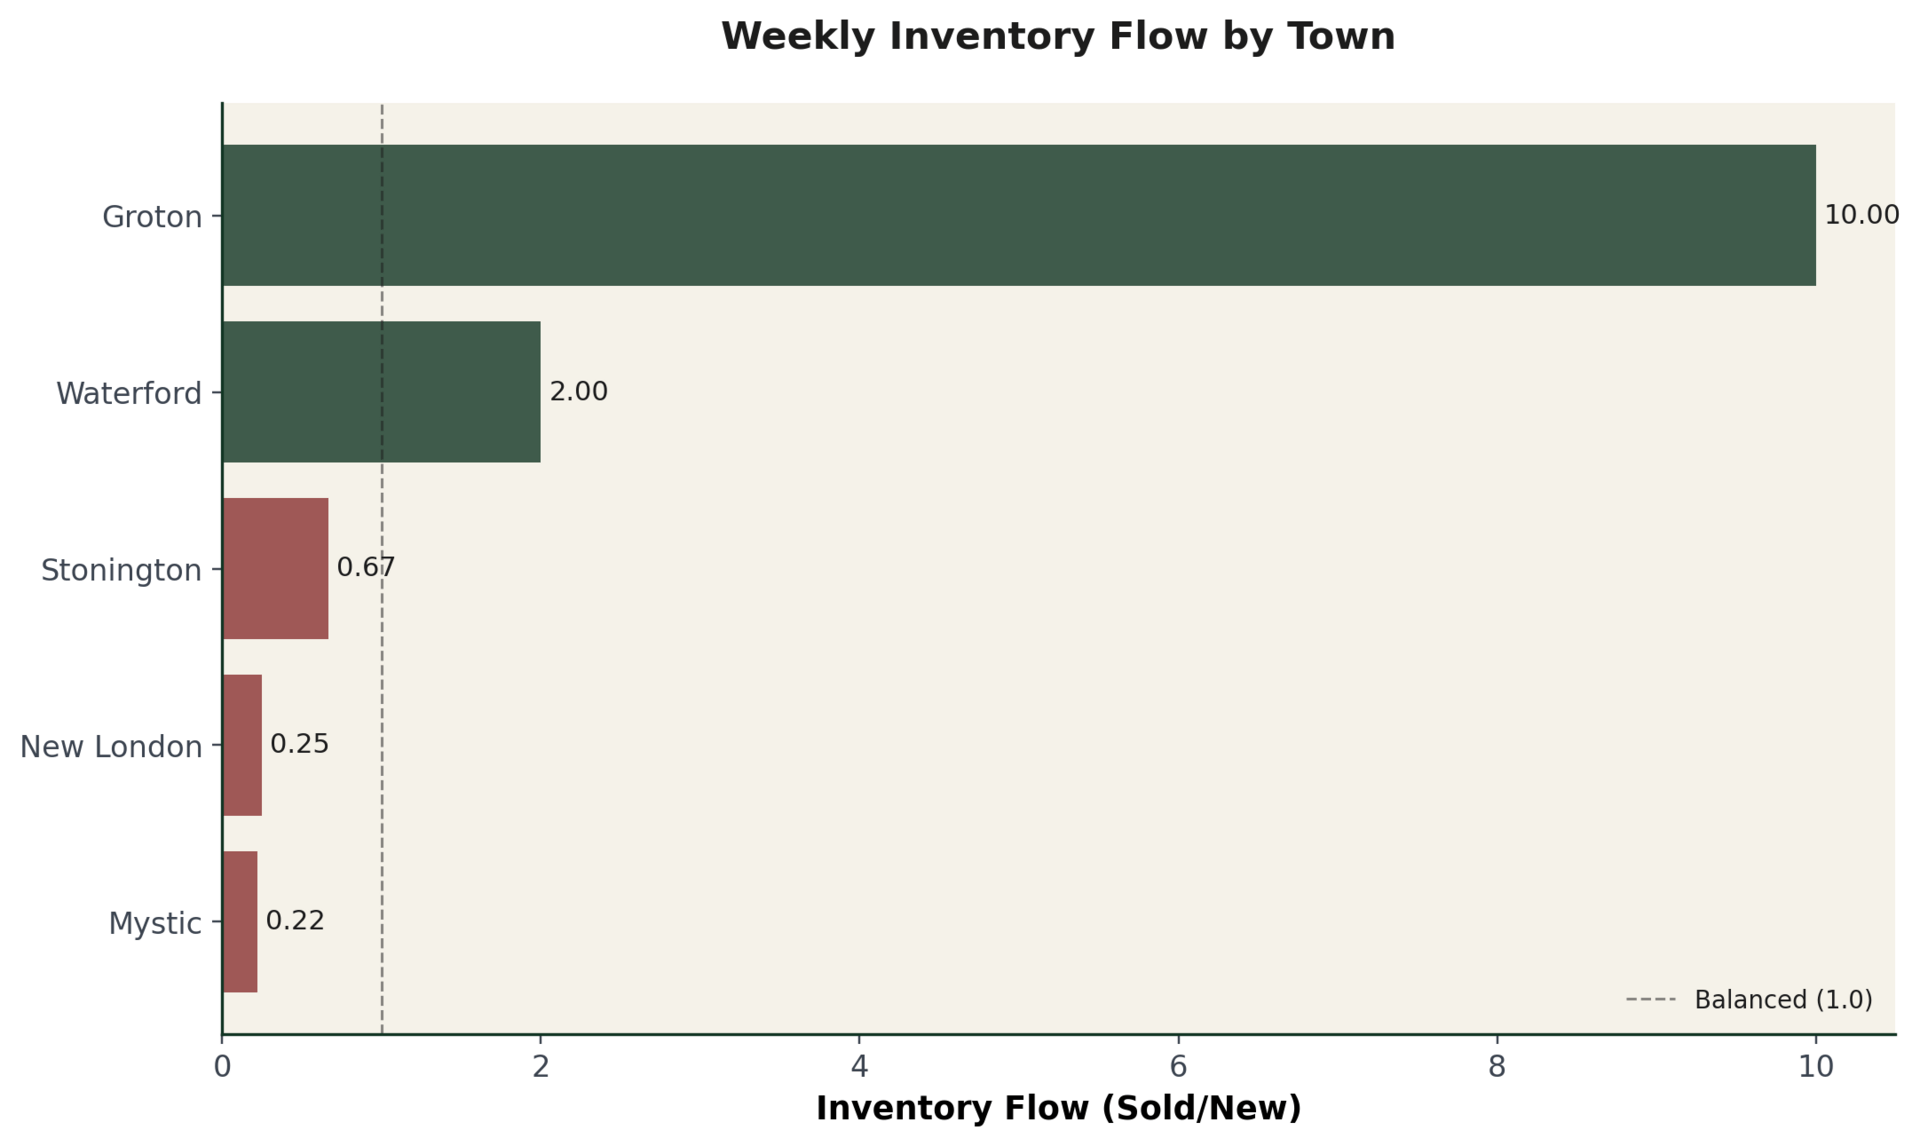
This week, Groton took the spotlight. Homes there are selling much faster than new ones are being listed, showing serious buyer momentum. Meanwhile, Mystic and Stonington saw new listings climb slightly, giving buyers a bit more breathing room.
Whether you are watching for your next opportunity or timing a sale before winter, here is how the numbers look across New London County.
📊 Inventory Flow
Where Are Homes Moving Fastest?

(Homes Sold vs. New Listings by Town)
Town | Homes Sold | New Listings | Market Direction |
|---|---|---|---|
Groton | 10 | 1 | 🔥 Shrinking fast (very strong demand) |
Waterford | 6 | 3 | Tight supply (leaning seller’s market) |
Stonington | 6 | 9 | Slightly cooling (more listings) |
Mystic | 2 | 9 | Cooling (buyer-friendly) |
New London | 2 | 8 | Cooling (buyer-friendly) |
County Total: 114 homes sold vs. 135 new listings (overall inventory slightly higher).
⏱ Median Days on Market

Median Day on Market
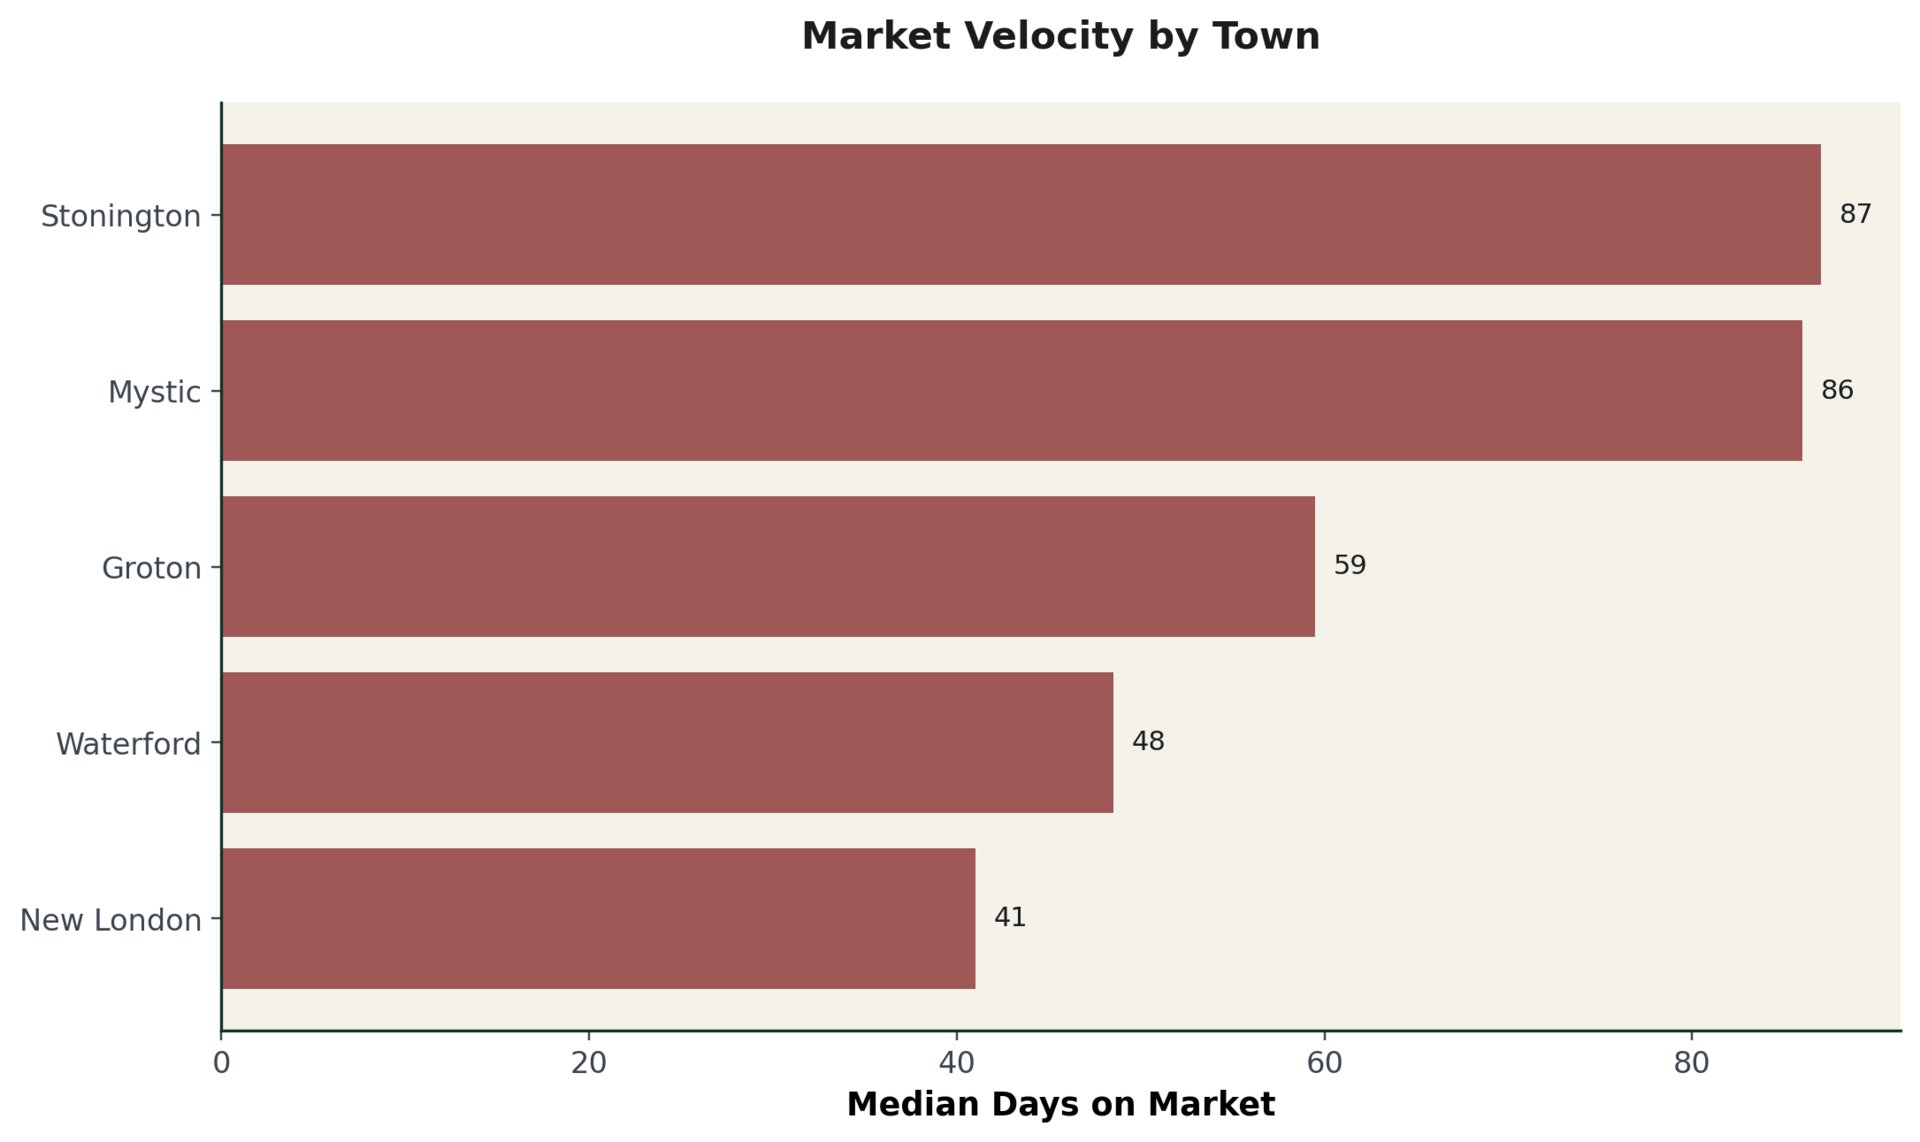
Mystic: 86 days
Stonington: 87 days
Groton: 59 days
New London: 41 days
Waterford: 48 days
Market Average: 64 days
Takeaway: Homes in Groton and New London continue to move faster than the county average, showing steady demand even as listings increase.
💸 Price Cuts by Town

(% of active listings with price cuts)
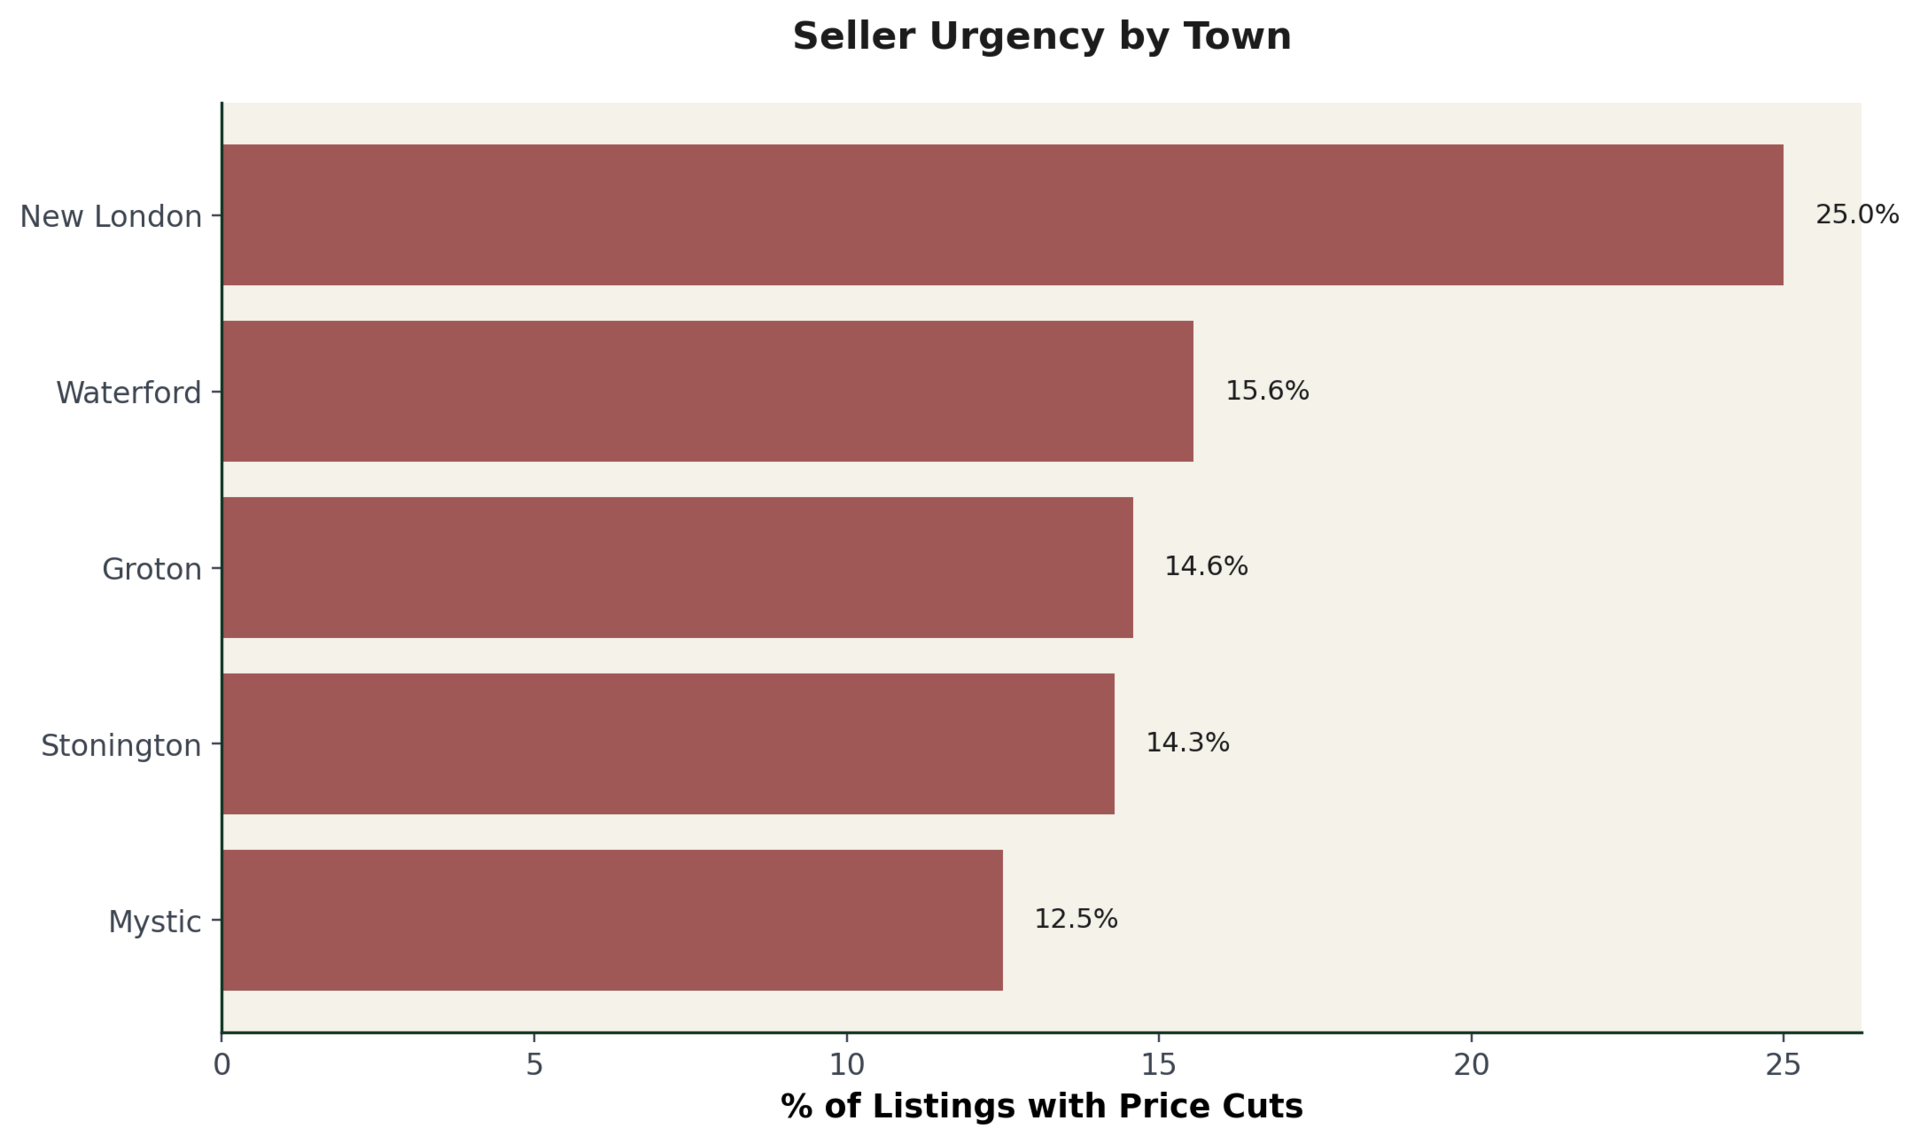
New London: 25.0%
Waterford: 15.6%
Groton: 14.6%
Stonington: 14.3%
Mystic: 12.5%
Takeaway: Sellers in New London are adjusting prices more than other towns as buyers grow selective.
🏡 Quick Hits
Market Snapshot: Groton $250K (PITI: $1,856/mo), New London $345K (PITI: $2,562/mo), Waterford $549K (PITI: $4,077/mo), Stonington $595K (PITI: $4,418/mo), Mystic $695K (PITI: $5,161/mo)
Rent vs Buy: Groton (1.19 - cheaper to buy), New London (0.68), Stonington (0.65), Mystic (0.58), Waterford (0.54)
Luxury Spotlight: 11 Main St, Mystic listed at $6.50M
Starter Homes: 76 listings under $300K, with Groton leading the count
Biggest Price Cut: 4 Island Ave, Groton reduced by $245K (11.4%) to $1.89M
Market Snapshot reflects median home prices for each town. PITI estimates assume a 20% down payment and a 6.25% fixed-rate mortgage over 30 years.
🚦 Closing Note
The shoreline market continues to show two different stories: cooling at the top end but still active for starter and mid-range homes. Groton remains one of the few towns where owning can still be cheaper than renting.
For sellers, accurate pricing and timing remain key. For buyers, competition is still real in certain zip codes, especially near the coast.
If this helped you see the market more clearly, share it with a friend or neighbor who’s watching the shoreline too.
📫Subscribe to Shoreline Ledger for free to get weekly, plain-English insights into the New London County housing market, straight to your inbox.
⚖️ Disclaimer
Data presented in this report was compiled from publicly available sources such as Redfin, Realtor.com, Zillow, and municipal open-data portals. Figures are intended to illustrate market direction, not certified MLS statistics.
Shoreline Ledger is an independent publication. I am not a licensed real estate professional, and this content should not be taken as financial or real estate advice. Always verify details before making buying or selling decisions.
